|
|
New Facility Clinical Depression Dashboard Available in EQRS
|
The Centers for Medicare & Medicaid Services (CMS)
have released a new Facility Clinical Depression Dashboard in the End
Stage Renal Disease (ESRD) Quality Reporting System (EQRS). The new
Facility Clinical Depression Dashboard provides dialysis facility
users and dialysis organizations with up-to-date information and
visualization on ESRD patient clinical depression data in-use at an
individual facility or, when applicable, throughout the dialysis
organization. Using an easy-to-use, intuitive dashboard interface,
users can view clinical depression data on an individual or aggregate
basis for any individual year. |
Clinical Depression Dashboards are available for Facility, ESRD Network, and CMS users. This EQRS News Flash will provide facility users with directions on accessing the new dashboard feature.
|
Accessing the Clinical Depression Dashboard
|
Follow the instructions below to access the Clinical Depression Dashboard:
-
Click the Reports Dashboards item in the navigation bar. The Reports selection screen displays.
|

|
-
Click the Facility Clinical Depression Dashboard option.
|

The Facility Clinical Depression Dashboard will display.
|
|
Dashboard Overview
|
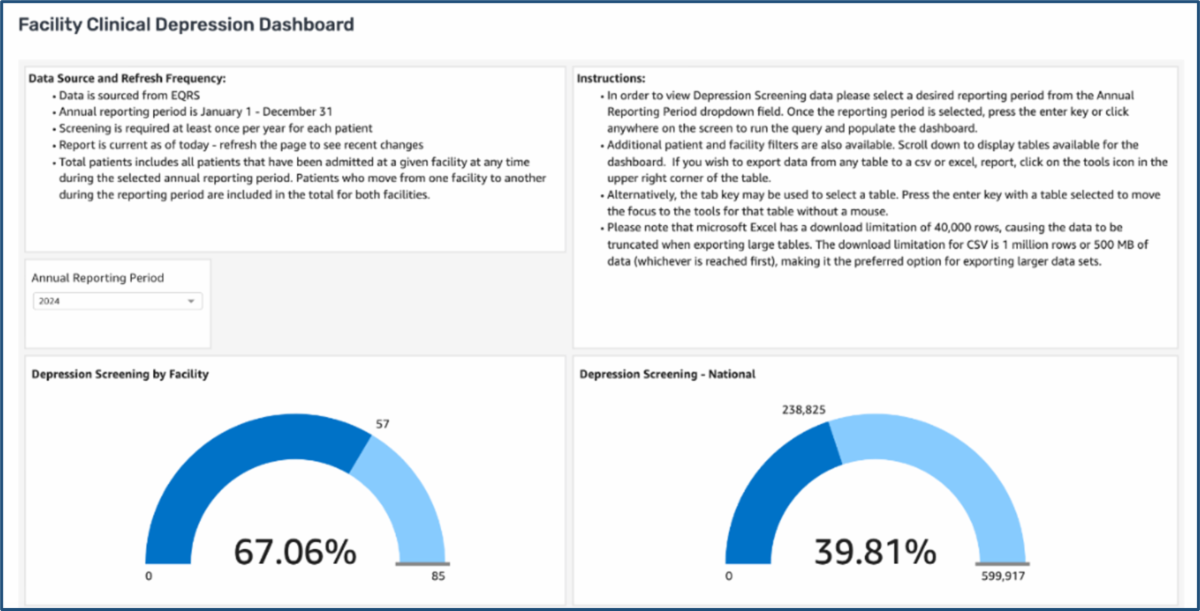
The top of the Facility Clinical Depression Dashboard contains information on the data sources used
(where the data comes from)and refresh frequency
(how often the data is updated) for the tables and graphs displayed on the page.
Additionally, the top of the dashboard contains information on instructionsfor using the dashboard.
Figure 1 – Data Source and Refresh Frequency Information
|

|
|
Figure 2 – Instructions on Using the Dashboard
|

|
Figure 3 below provides an example of the Dashboard.
|
|
Figure 3- Facility Clinical Depression Dashboard Example
|
|
|
|
Annual Reporting Period Filter
|
|
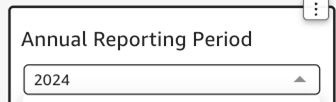
The Annual Reporting Period filter drop-down list
(Figure 4) enables users to update the dashboard with data for any
given calendar year. The drop-down list contains all available years for display for up to the past five years.
Click on the Annual Reporting Period drop-down list and select the calendar year to update the dashboard.
Figure 4 – Annual Reporting Period Drop-Down List
|
 |
|
Note: Users can only select a single year. The dashboard can only display data for one year at a time.
The Search Value function in the Annual Reporting Period drop-down lets users search by text for a specific year.
Click the Annual Reporting Period drop-down menu and enter the search criteria in the search value box as seen in Figure 5.
Figure 5 – Annual Reporting Period Search Value Tool
|

|
|
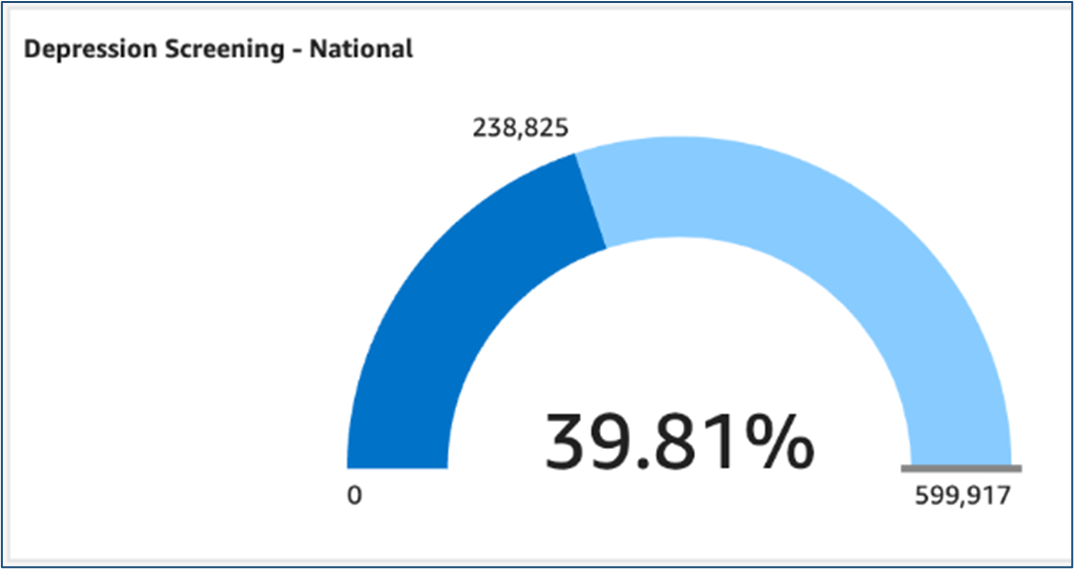
Clinical Depression “Speedometer” Graphs
The “speedometer” graphs on the Facility Clinical Depression Dashboard display the percentage of patients screened for
depression at the Facility and/or National level. The graphs provide a quick visual synopsis of facility depression screening data for the
selected year, as illustrated in Figures 6 and 7 below.
Figure 6 – Depression Screening Data by Facility
|

Figure 7 – Depression Screening Data, National
|
|
The graphs also feature “Tool Tips” that provide detailed information. Users can hover the mouse cursor over the graph to view this information, as shown in Figure 6 above.
|
Depression Screening – Facility Summary
The Depression Screening – Facility Summary section of the dashboard provides a table containing the facility’s
depression screening data. An example illustrating a portion of this table is provided in Figure 8 below:
Figure 8 – Depression Screening – Facility Summary Table Example

|
|
The complete data displayed in this table includes:
- Time Period
- Facility CMS Certification Number (CCN)
- Facility Name
- Facility ID
- EDI Organization
- EDI Facility ID
- Owned By
- Network
- Total Patients
- Screened Patients
|
- Missing
- Screening Rate
- Positive – Follow Up Documented
- Positive – No Follow Up – Not Eligible
- Positive – No Follow Up – No Reason
- EDI Facility ID
- Negative
- Not Documented – Not Eligible
- Not Documented – No Reason Given
|
|
Depression Screening – Patient Data
The Depression Screening – Patient Data table contains all individual patient depression screening details that contribute
to the graphs and data displayed on the dashboard. When a user selects an Annual Reporting Period, all associated patient data for the chosen
period displays in the table as shown in Figure 9.
Figure 9 – Depression Screening – Patient Data Table Example
|

|
|
The table contains the following data:
- Time Period
- UPI
- Patient Last and First Name
- Date of Birth
- Age
- Sex at Birth
- Screening Submitted?
- Depression Screening Result
- Date Submitted
|
- Patient Race
- Patient Ethnicity
- CCN
- Facility Name
- EDI Organization
- EDI Patient ID
- Network
- Facility ID
|
|
Patient Data Filters
The Depression Screening – Patient Details section contains a Filter by: (Patient Details Dashboard) tool (shown
in Figure 10) with multiple filters that you can use to refine the data displayed in the table.
Figure 10 – Filter By: Patient Details Dashboard Filter Tool
|

|
|
The EQRS UPI filter (shown in Figure 11) allows users to filter by specific patient Unique Patient Identifier (UPI) data.
Type a UPI number and press the Enter key to initiate the search.
The Patient Details Dashboard table will display data matching your search.
Figure 11 – EQRS UPI Filter By Tool
|

|
|
The Screening Submitted filter (shown in Figure 12) allows users to filter by screening submission status.
Click the drop-down and use the check boxes to specify your custom search.
You can also enter a submission status in the Search Value field to quickly locate a status to check.
Click Enter to run your search and refine the displayed data.
Figure 12 – Screening Submitted? Filter Tool
|

|
|
The Depression Screening Result filter (shown in Figure 13) allows users to filter by patient Depression Screening result.
Click the drop-down and use the check boxes to specify the screening result statuses for your custom search.
You can also enter a screening result status in the Search Value field to quickly locate result statuses to check.
Click Enter to run your search and refine the displayed data.
Figure 13 – Screening Submitted? Filter Tool
|

|
Depression Screening – Patient Data Graph
The Depression Screening – Patient Data graph (Figure 14) contains a “pie” graph that summarizes the results of depression screenings for patients admitted during the selected clinical year.
A color key is located to the right of the graph that explains the various elements in the pie graph.
Figure 14 – Depression Screening Pie Graph Example
|

|
For More Information
If you have additional questions on the Facility Clinical Depression Dashboard, please contact
eqrssupport@cms.hhs.gov
|
|
Thank you,
The ESRD Outreach, Communication, and Training (EOCT) Team
|
|
Website:
http://www.MyCROWNWeb.org
For Questions:
QualityNet
Q&A Tool
|